GitHub: nchah/tech-graph
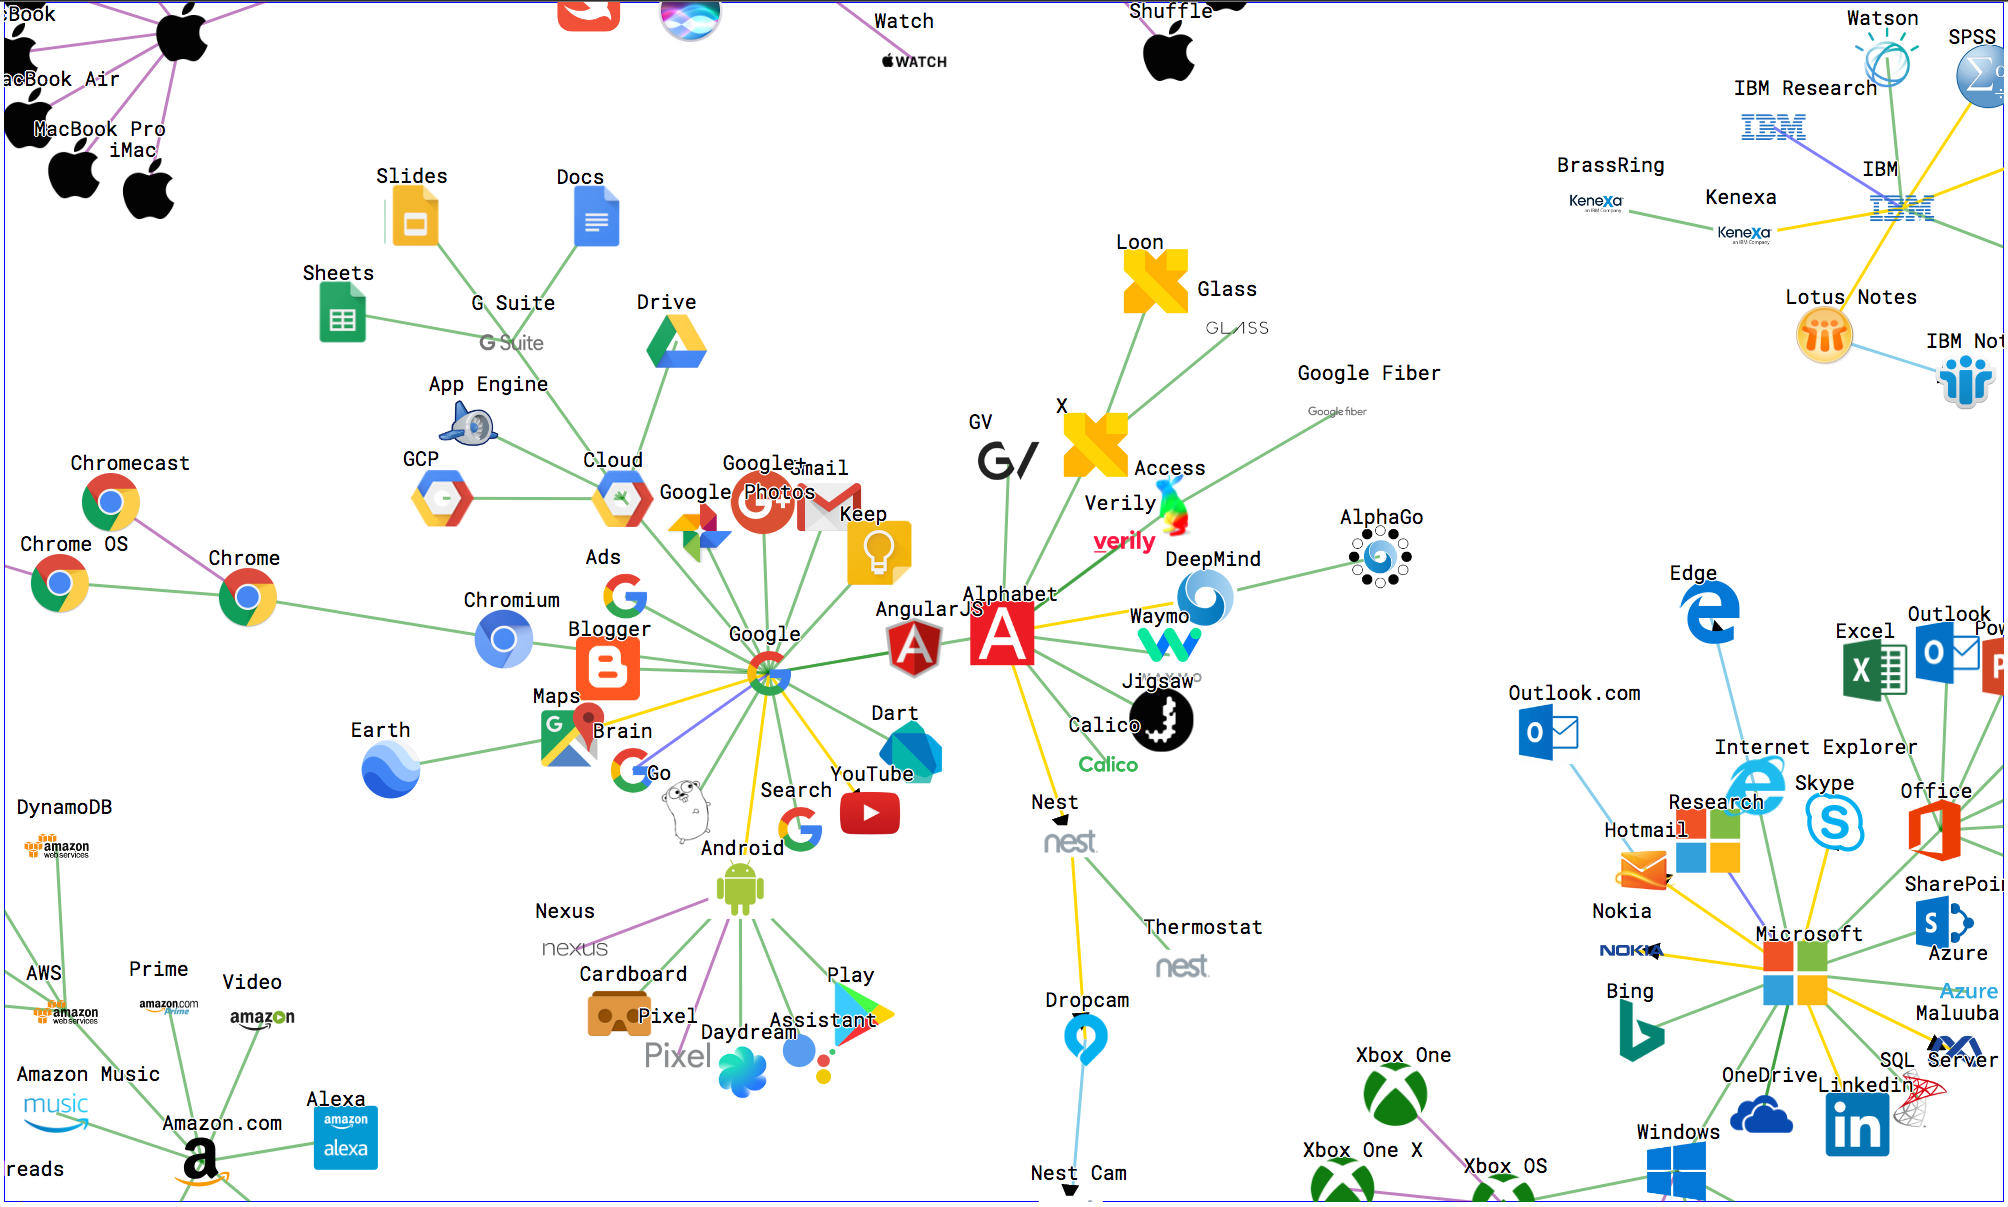
A force-directed graph of notable tech companies, their products, and services. View the full interactive graph here.
Disclaimer: All information on this page is presented for informational purposes only. There is no affiliation with any of the companies shown here.
Background
This graph started as a side project one weekend in response to some recurring trends I saw with regards to acquisitions of tech companies and products. Upon hearing that a company was acquired by [TECH GIANT], this would often elicit a common set of questions. Why did they acquire them? What’s the impact for that company and other competitors? What else do they own? With the a great deal of attention given to tech companies and startups with the recent advances in machine learning and artificial intelligence, it seemed worthwhile to map out the various entities that fall under each major tech company.
This graph can be interpreted on different levels. At a surface level, this is a fun and interactive visualization. Move the clusters around and rearrange their links, observing what links to what. At another level, this graph may show how the different companies are structured and how this is a reflection of their operations and culture. In other ways, this graph may lend itself well to arguments for exercising caution in how one consumes the vast technological offerings presented by these companies. The possible use cases can range from the simple to the complex, and are open to interpretation.